Comparison for Individual Digits
Figures to compare metrics for Sync HN vs Async HN vs SOM
Note: Metrics for Asynchronous Hopfield Network are derived using Ruchita Mijagiri’s code
[1]:
# imports

import matplotlib.pyplot as plt
import pickle
import gc
import seaborn as sns
import pandas as pd
import numpy as np
import mplcyberpunk

plt.style.use("cyberpunk")

seed = 42
np.random.seed(seed)
[10]:
# setting font size for graphs

SIZE = 12

plt.rc('font', size=SIZE)
plt.rc('axes', titlesize=SIZE)
plt.rc('axes', labelsize=SIZE)
plt.rc('xtick', labelsize=SIZE)
plt.rc('ytick', labelsize=SIZE)
plt.rc('legend', fontsize=SIZE)
plt.rc('figure', titlesize=SIZE)

# set color cycle

plt.rcParams["axes.prop_cycle"] = plt.cycler("color", plt.cm.tab10.colors)
[3]:
# metrics for sync hn

with open("mse_sync.pkl", 'rb') as f:
    mse_sync = pickle.load(f)
with open("psnr_sync.pkl", 'rb') as f:
    psnr_sync = pickle.load(f)
with open("ssim_sync.pkl", 'rb') as f:
    ssim_sync = pickle.load(f)

# metrics for som

with open("mse_som.pkl", 'rb') as f:
    mse_som = pickle.load(f)
with open("psnr_som.pkl", 'rb') as f:
    psnr_som = pickle.load(f)
with open("ssim_som.pkl", 'rb') as f:
    ssim_som = pickle.load(f)

# metrics for async hn

with open("mse_async.pkl", 'rb') as f:
    mse_async = pickle.load(f)
with open("psnr_async.pkl", 'rb') as f:
    psnr_async = pickle.load(f)
with open("ssim_async.pkl", 'rb') as f:
    ssim_async = pickle.load(f)
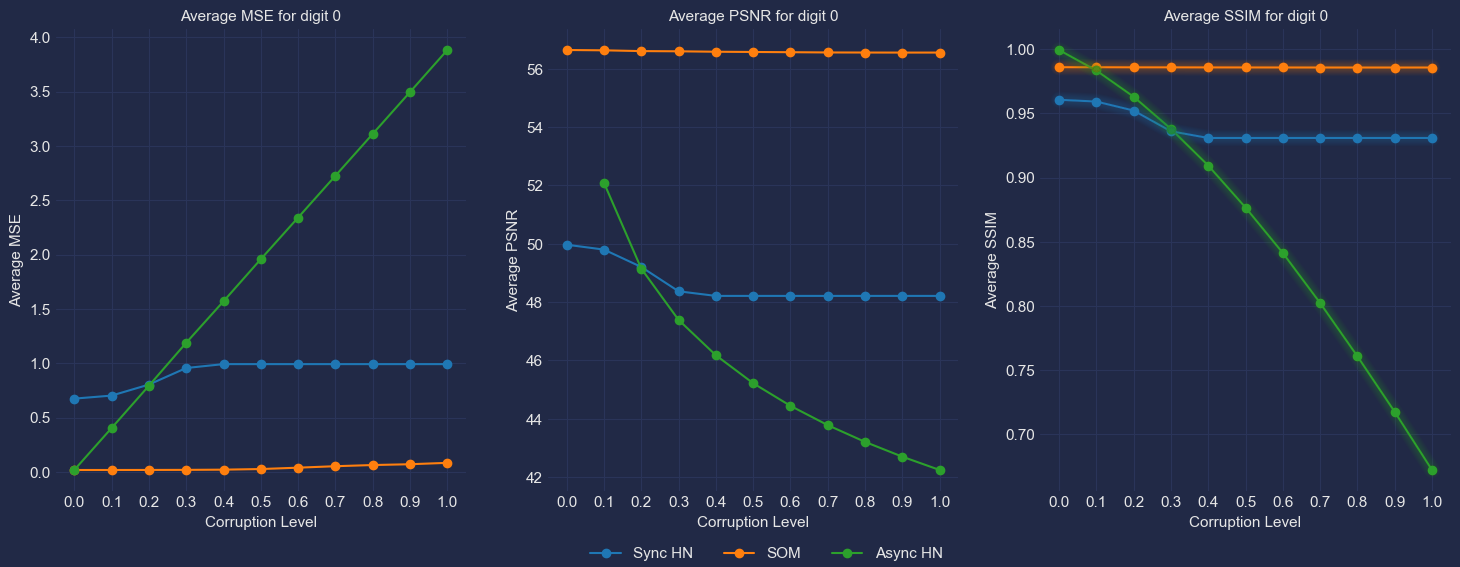
Digit 0
[32]:
fig, axes = plt.subplots(1, 3, figsize=(18, 6))

axes[0].plot(np.arange(0, 1.1, 0.1), mse_sync[0], marker='o')
axes[0].plot(np.arange(0, 1.1, 0.1), mse_som[0], marker='o')
axes[0].plot(np.arange(0, 1.1, 0.1), mse_async[0], marker='o')
axes[0].set_xlabel("Corruption Level")
axes[0].set_ylabel("Average MSE")
axes[0].set_xticks(np.arange(0, 1.1, 0.1))
axes[0].set_title("Average MSE for digit 0")

axes[1].plot(np.arange(0, 1.1, 0.1), psnr_sync[0], marker='o')
axes[1].plot(np.arange(0, 1.1, 0.1), psnr_som[0], marker='o')
axes[1].plot(np.arange(0, 1.1, 0.1), psnr_async[0], marker='o')
axes[1].set_xlabel("Corruption Level")
axes[1].set_ylabel("Average PSNR")
axes[1].set_xticks(np.arange(0, 1.1, 0.1))
axes[1].set_title("Average PSNR for digit 0")

axes[2].plot(np.arange(0, 1.1, 0.1), ssim_sync[0], marker='o')
axes[2].plot(np.arange(0, 1.1, 0.1), ssim_som[0], marker='o')
axes[2].plot(np.arange(0, 1.1, 0.1), ssim_async[0], marker='o')
axes[2].set_xlabel("Corruption Level")
axes[2].set_ylabel("Average SSIM")
axes[2].set_xticks(np.arange(0, 1.1, 0.1))
axes[2].set_title("Average SSIM for digit 0")

fig.legend(['Sync HN', 'SOM', 'Async HN'], loc = (0.4, 0), ncol=3)
mplcyberpunk.make_lines_glow()
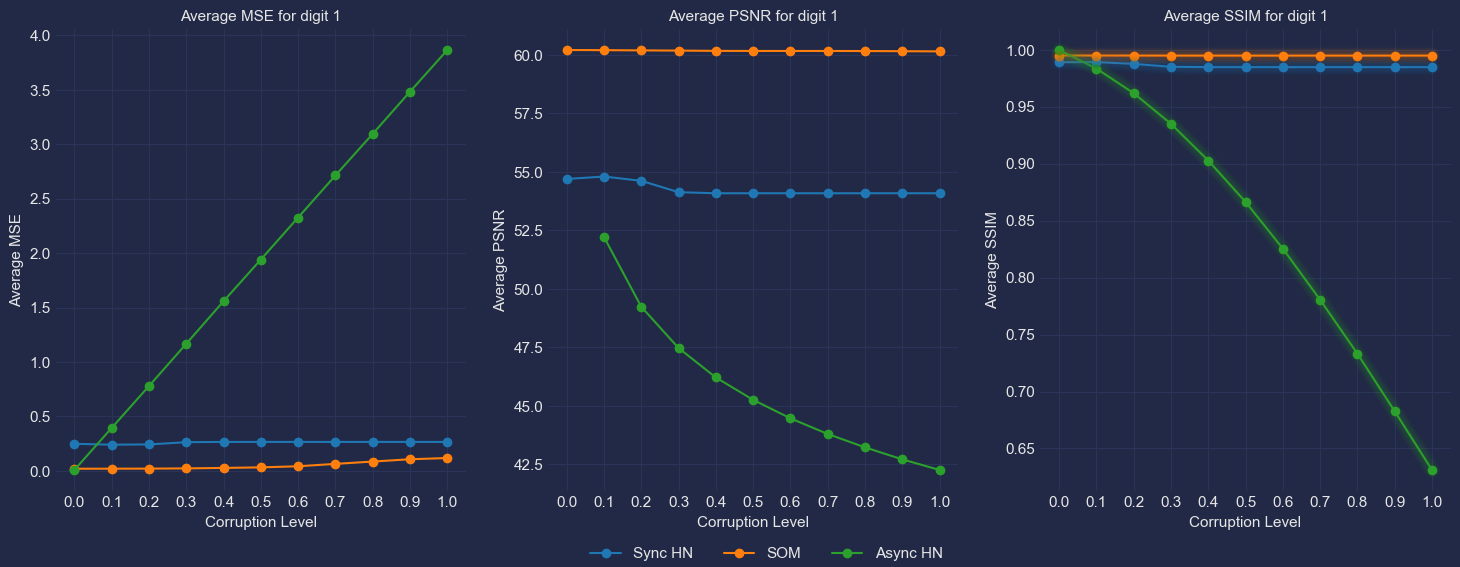
Digit 1
[34]:
fig, axes = plt.subplots(1, 3, figsize=(18, 6))

axes[0].plot(np.arange(0, 1.1, 0.1), mse_sync[1], marker='o')
axes[0].plot(np.arange(0, 1.1, 0.1), mse_som[1], marker='o')
axes[0].plot(np.arange(0, 1.1, 0.1), mse_async[1], marker='o')
axes[0].set_xlabel("Corruption Level")
axes[0].set_ylabel("Average MSE")
axes[0].set_xticks(np.arange(0, 1.1, 0.1))
axes[0].set_title("Average MSE for digit 1")

axes[1].plot(np.arange(0, 1.1, 0.1), psnr_sync[1], marker='o')
axes[1].plot(np.arange(0, 1.1, 0.1), psnr_som[1], marker='o')
axes[1].plot(np.arange(0, 1.1, 0.1), psnr_async[1], marker='o')
axes[1].set_xlabel("Corruption Level")
axes[1].set_ylabel("Average PSNR")
axes[1].set_xticks(np.arange(0, 1.1, 0.1))
axes[1].set_title("Average PSNR for digit 1")

axes[2].plot(np.arange(0, 1.1, 0.1), ssim_sync[1], marker='o')
axes[2].plot(np.arange(0, 1.1, 0.1), ssim_som[1], marker='o')
axes[2].plot(np.arange(0, 1.1, 0.1), ssim_async[1], marker='o')
axes[2].set_xlabel("Corruption Level")
axes[2].set_ylabel("Average SSIM")
axes[2].set_xticks(np.arange(0, 1.1, 0.1))
axes[2].set_title("Average SSIM for digit 1")

fig.legend(['Sync HN', 'SOM', 'Async HN'], loc = (0.4, 0), ncol=3)
mplcyberpunk.make_lines_glow()
Digit 2
[36]:
fig, axes = plt.subplots(1, 3, figsize=(18, 6))

axes[0].plot(np.arange(0, 1.1, 0.1), mse_sync[2], marker='o')
axes[0].plot(np.arange(0, 1.1, 0.1), mse_som[2], marker='o')
axes[0].plot(np.arange(0, 1.1, 0.1), mse_async[2], marker='o')
axes[0].set_xlabel("Corruption Level")
axes[0].set_ylabel("Average MSE")
axes[0].set_xticks(np.arange(0, 1.1, 0.1))
axes[0].set_title("Average MSE for digit 2")

axes[1].plot(np.arange(0, 1.1, 0.1), psnr_sync[2], marker='o')
axes[1].plot(np.arange(0, 1.1, 0.1), psnr_som[2], marker='o')
axes[1].plot(np.arange(0, 1.1, 0.1), psnr_async[2], marker='o')
axes[1].set_xlabel("Corruption Level")
axes[1].set_ylabel("Average PSNR")
axes[1].set_xticks(np.arange(0, 1.1, 0.1))
axes[1].set_title("Average PSNR for digit 2")

axes[2].plot(np.arange(0, 1.1, 0.1), ssim_sync[2], marker='o')
axes[2].plot(np.arange(0, 1.1, 0.1), ssim_som[2], marker='o')
axes[2].plot(np.arange(0, 1.1, 0.1), ssim_async[2], marker='o')
axes[2].set_xlabel("Corruption Level")
axes[2].set_ylabel("Average SSIM")
axes[2].set_xticks(np.arange(0, 1.1, 0.1))
axes[2].set_title("Average SSIM for digit 2")

fig.legend(['Sync HN', 'SOM', 'Async HN'], loc = (0.4, 0), ncol=3)
mplcyberpunk.make_lines_glow()

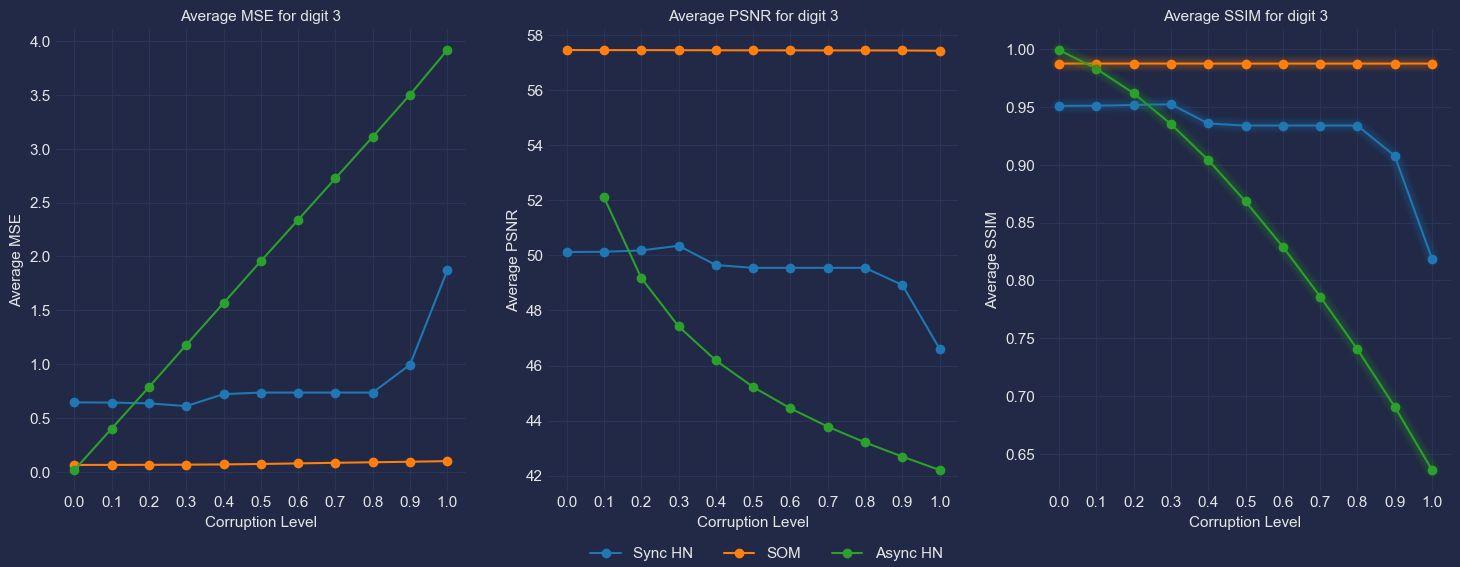
Digit 3
[37]:
fig, axes = plt.subplots(1, 3, figsize=(18, 6))

axes[0].plot(np.arange(0, 1.1, 0.1), mse_sync[3], marker='o')
axes[0].plot(np.arange(0, 1.1, 0.1), mse_som[3], marker='o')
axes[0].plot(np.arange(0, 1.1, 0.1), mse_async[3], marker='o')
axes[0].set_xlabel("Corruption Level")
axes[0].set_ylabel("Average MSE")
axes[0].set_xticks(np.arange(0, 1.1, 0.1))
axes[0].set_title("Average MSE for digit 3")

axes[1].plot(np.arange(0, 1.1, 0.1), psnr_sync[3], marker='o')
axes[1].plot(np.arange(0, 1.1, 0.1), psnr_som[3], marker='o')
axes[1].plot(np.arange(0, 1.1, 0.1), psnr_async[3], marker='o')
axes[1].set_xlabel("Corruption Level")
axes[1].set_ylabel("Average PSNR")
axes[1].set_xticks(np.arange(0, 1.1, 0.1))
axes[1].set_title("Average PSNR for digit 3")

axes[2].plot(np.arange(0, 1.1, 0.1), ssim_sync[3], marker='o')
axes[2].plot(np.arange(0, 1.1, 0.1), ssim_som[3], marker='o')
axes[2].plot(np.arange(0, 1.1, 0.1), ssim_async[3], marker='o')
axes[2].set_xlabel("Corruption Level")
axes[2].set_ylabel("Average SSIM")
axes[2].set_xticks(np.arange(0, 1.1, 0.1))
axes[2].set_title("Average SSIM for digit 3")

fig.legend(['Sync HN', 'SOM', 'Async HN'], loc = (0.4, 0), ncol=3)
mplcyberpunk.make_lines_glow()
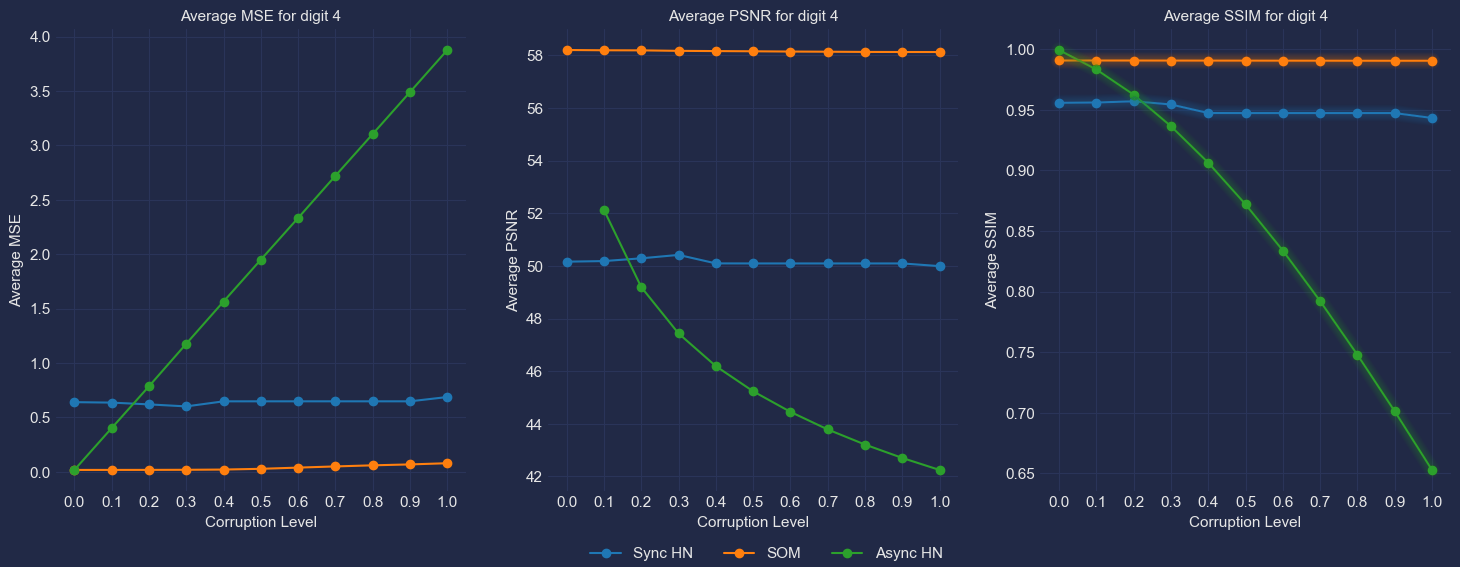
Digit 4
[39]:
fig, axes = plt.subplots(1, 3, figsize=(18, 6))

axes[0].plot(np.arange(0, 1.1, 0.1), mse_sync[4], marker='o')
axes[0].plot(np.arange(0, 1.1, 0.1), mse_som[4], marker='o')
axes[0].plot(np.arange(0, 1.1, 0.1), mse_async[4], marker='o')
axes[0].set_xlabel("Corruption Level")
axes[0].set_ylabel("Average MSE")
axes[0].set_xticks(np.arange(0, 1.1, 0.1))
axes[0].set_title("Average MSE for digit 4")

axes[1].plot(np.arange(0, 1.1, 0.1), psnr_sync[4], marker='o')
axes[1].plot(np.arange(0, 1.1, 0.1), psnr_som[4], marker='o')
axes[1].plot(np.arange(0, 1.1, 0.1), psnr_async[4], marker='o')
axes[1].set_xlabel("Corruption Level")
axes[1].set_ylabel("Average PSNR")
axes[1].set_xticks(np.arange(0, 1.1, 0.1))
axes[1].set_title("Average PSNR for digit 4")

axes[2].plot(np.arange(0, 1.1, 0.1), ssim_sync[4], marker='o')
axes[2].plot(np.arange(0, 1.1, 0.1), ssim_som[4], marker='o')
axes[2].plot(np.arange(0, 1.1, 0.1), ssim_async[4], marker='o')
axes[2].set_xlabel("Corruption Level")
axes[2].set_ylabel("Average SSIM")
axes[2].set_xticks(np.arange(0, 1.1, 0.1))
axes[2].set_title("Average SSIM for digit 4")

fig.legend(['Sync HN', 'SOM', 'Async HN'], loc = (0.4, 0), ncol=3)
mplcyberpunk.make_lines_glow()
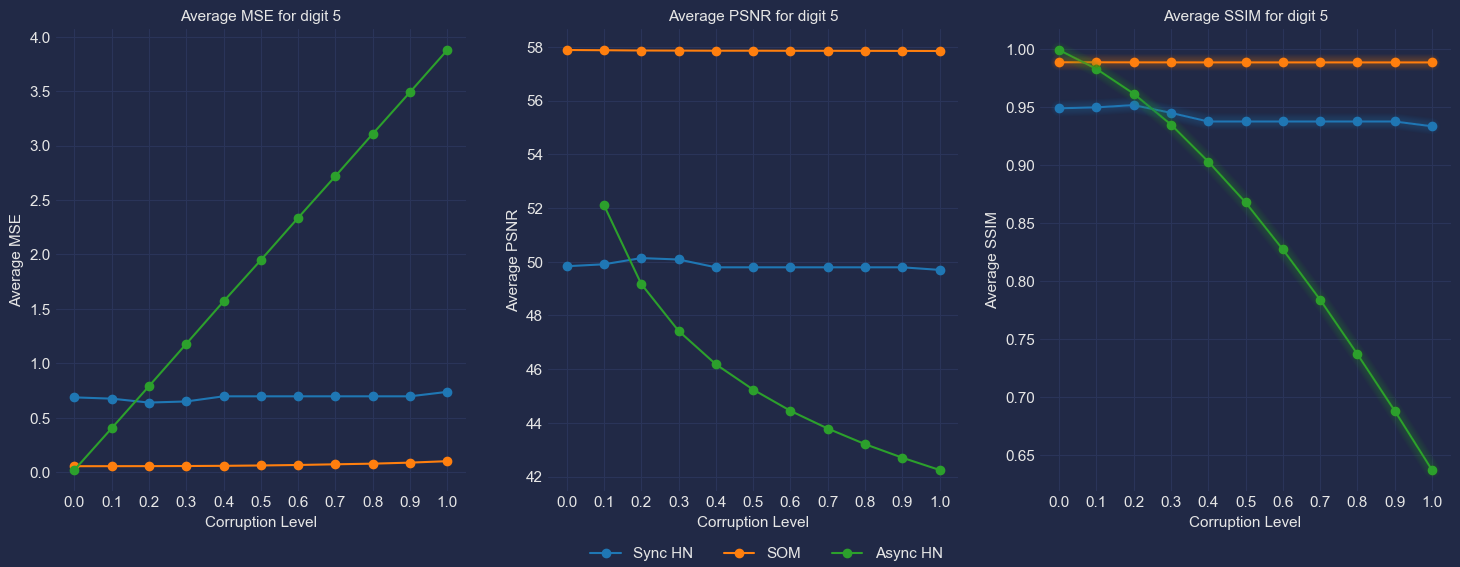
Digit 5
[40]:
fig, axes = plt.subplots(1, 3, figsize=(18, 6))

axes[0].plot(np.arange(0, 1.1, 0.1), mse_sync[5], marker='o')
axes[0].plot(np.arange(0, 1.1, 0.1), mse_som[5], marker='o')
axes[0].plot(np.arange(0, 1.1, 0.1), mse_async[5], marker='o')
axes[0].set_xlabel("Corruption Level")
axes[0].set_ylabel("Average MSE")
axes[0].set_xticks(np.arange(0, 1.1, 0.1))
axes[0].set_title("Average MSE for digit 5")

axes[1].plot(np.arange(0, 1.1, 0.1), psnr_sync[5], marker='o')
axes[1].plot(np.arange(0, 1.1, 0.1), psnr_som[5], marker='o')
axes[1].plot(np.arange(0, 1.1, 0.1), psnr_async[5], marker='o')
axes[1].set_xlabel("Corruption Level")
axes[1].set_ylabel("Average PSNR")
axes[1].set_xticks(np.arange(0, 1.1, 0.1))
axes[1].set_title("Average PSNR for digit 5")

axes[2].plot(np.arange(0, 1.1, 0.1), ssim_sync[5], marker='o')
axes[2].plot(np.arange(0, 1.1, 0.1), ssim_som[5], marker='o')
axes[2].plot(np.arange(0, 1.1, 0.1), ssim_async[5], marker='o')
axes[2].set_xlabel("Corruption Level")
axes[2].set_ylabel("Average SSIM")
axes[2].set_xticks(np.arange(0, 1.1, 0.1))
axes[2].set_title("Average SSIM for digit 5")

fig.legend(['Sync HN', 'SOM', 'Async HN'], loc = (0.4, 0), ncol=3)
mplcyberpunk.make_lines_glow()
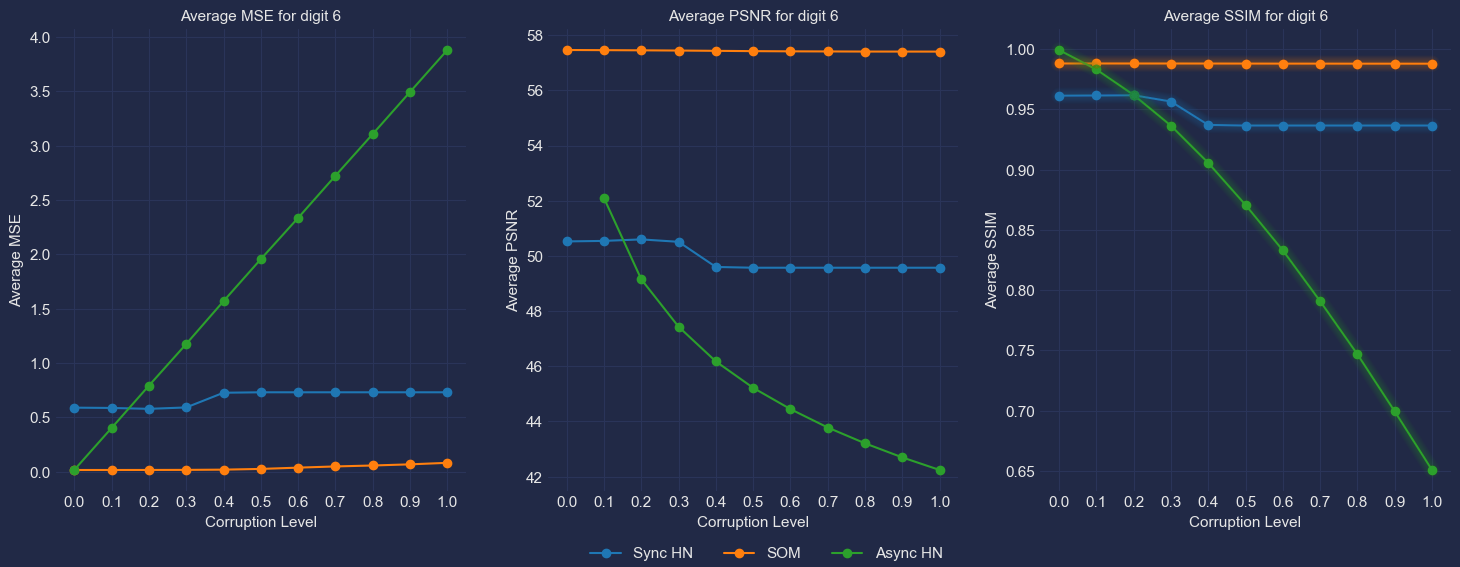
Digit 6
[41]:
fig, axes = plt.subplots(1, 3, figsize=(18, 6))

axes[0].plot(np.arange(0, 1.1, 0.1), mse_sync[6], marker='o')
axes[0].plot(np.arange(0, 1.1, 0.1), mse_som[6], marker='o')
axes[0].plot(np.arange(0, 1.1, 0.1), mse_async[6], marker='o')
axes[0].set_xlabel("Corruption Level")
axes[0].set_ylabel("Average MSE")
axes[0].set_xticks(np.arange(0, 1.1, 0.1))
axes[0].set_title("Average MSE for digit 6")

axes[1].plot(np.arange(0, 1.1, 0.1), psnr_sync[6], marker='o')
axes[1].plot(np.arange(0, 1.1, 0.1), psnr_som[6], marker='o')
axes[1].plot(np.arange(0, 1.1, 0.1), psnr_async[6], marker='o')
axes[1].set_xlabel("Corruption Level")
axes[1].set_ylabel("Average PSNR")
axes[1].set_xticks(np.arange(0, 1.1, 0.1))
axes[1].set_title("Average PSNR for digit 6")

axes[2].plot(np.arange(0, 1.1, 0.1), ssim_sync[6], marker='o')
axes[2].plot(np.arange(0, 1.1, 0.1), ssim_som[6], marker='o')
axes[2].plot(np.arange(0, 1.1, 0.1), ssim_async[6], marker='o')
axes[2].set_xlabel("Corruption Level")
axes[2].set_ylabel("Average SSIM")
axes[2].set_xticks(np.arange(0, 1.1, 0.1))
axes[2].set_title("Average SSIM for digit 6")

fig.legend(['Sync HN', 'SOM', 'Async HN'], loc = (0.4, 0), ncol=3)
mplcyberpunk.make_lines_glow()
Digit 7
[43]:
fig, axes = plt.subplots(1, 3, figsize=(18, 6))

axes[0].plot(np.arange(0, 1.1, 0.1), mse_sync[7], marker='o')
axes[0].plot(np.arange(0, 1.1, 0.1), mse_som[7], marker='o')
axes[0].plot(np.arange(0, 1.1, 0.1), mse_async[7], marker='o')
axes[0].set_xlabel("Corruption Level")
axes[0].set_ylabel("Average MSE")
axes[0].set_xticks(np.arange(0, 1.1, 0.1))
axes[0].set_title("Average MSE for digit 7")

axes[1].plot(np.arange(0, 1.1, 0.1), psnr_sync[7], marker='o')
axes[1].plot(np.arange(0, 1.1, 0.1), psnr_som[7], marker='o')
axes[1].plot(np.arange(0, 1.1, 0.1), psnr_async[7], marker='o')
axes[1].set_xlabel("Corruption Level")
axes[1].set_ylabel("Average PSNR")
axes[1].set_xticks(np.arange(0, 1.1, 0.1))
axes[1].set_title("Average PSNR for digit 7")

axes[2].plot(np.arange(0, 1.1, 0.1), ssim_sync[7], marker='o')
axes[2].plot(np.arange(0, 1.1, 0.1), ssim_som[7], marker='o')
axes[2].plot(np.arange(0, 1.1, 0.1), ssim_async[7], marker='o')
axes[2].set_xlabel("Corruption Level")
axes[2].set_ylabel("Average SSIM")
axes[2].set_xticks(np.arange(0, 1.1, 0.1))
axes[2].set_title("Average SSIM for digit 7")

fig.legend(['Sync HN', 'SOM', 'Async HN'], loc = (0.4, 0), ncol=3)
mplcyberpunk.make_lines_glow()

Digit 8
[44]:
fig, axes = plt.subplots(1, 3, figsize=(18, 6))

axes[0].plot(np.arange(0, 1.1, 0.1), mse_sync[8], marker='o')
axes[0].plot(np.arange(0, 1.1, 0.1), mse_som[8], marker='o')
axes[0].plot(np.arange(0, 1.1, 0.1), mse_async[8], marker='o')
axes[0].set_xlabel("Corruption Level")
axes[0].set_ylabel("Average MSE")
axes[0].set_xticks(np.arange(0, 1.1, 0.1))
axes[0].set_title("Average MSE for digit 8")

axes[1].plot(np.arange(0, 1.1, 0.1), psnr_sync[8], marker='o')
axes[1].plot(np.arange(0, 1.1, 0.1), psnr_som[8], marker='o')
axes[1].plot(np.arange(0, 1.1, 0.1), psnr_async[8], marker='o')
axes[1].set_xlabel("Corruption Level")
axes[1].set_ylabel("Average PSNR")
axes[1].set_xticks(np.arange(0, 1.1, 0.1))
axes[1].set_title("Average PSNR for digit 8")

axes[2].plot(np.arange(0, 1.1, 0.1), ssim_sync[8], marker='o')
axes[2].plot(np.arange(0, 1.1, 0.1), ssim_som[8], marker='o')
axes[2].plot(np.arange(0, 1.1, 0.1), ssim_async[8], marker='o')
axes[2].set_xlabel("Corruption Level")
axes[2].set_ylabel("Average SSIM")
axes[2].set_xticks(np.arange(0, 1.1, 0.1))
axes[2].set_title("Average SSIM for digit 8")

fig.legend(['Sync HN', 'SOM', 'Async HN'], loc = (0.4, 0), ncol=3)
mplcyberpunk.make_lines_glow()

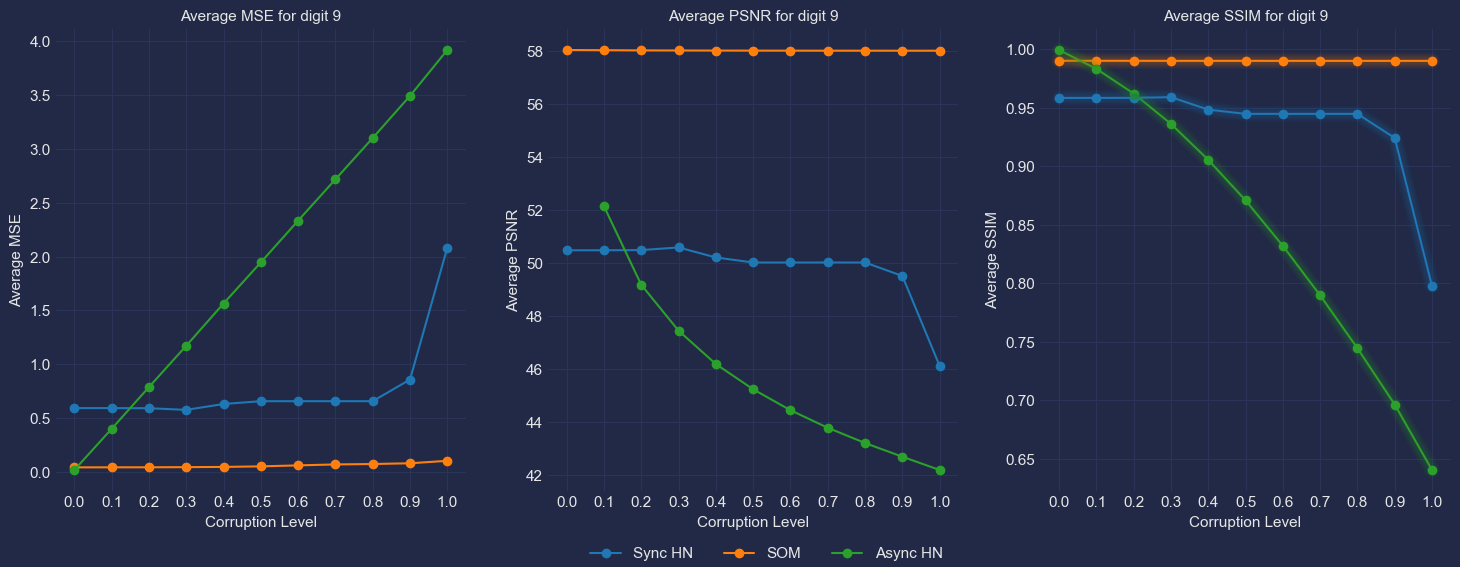
Digit 9
[46]:
fig, axes = plt.subplots(1, 3, figsize=(18, 6))

axes[0].plot(np.arange(0, 1.1, 0.1), mse_sync[9], marker='o')
axes[0].plot(np.arange(0, 1.1, 0.1), mse_som[9], marker='o')
axes[0].plot(np.arange(0, 1.1, 0.1), mse_async[9], marker='o')
axes[0].set_xlabel("Corruption Level")
axes[0].set_ylabel("Average MSE")
axes[0].set_xticks(np.arange(0, 1.1, 0.1))
axes[0].set_title("Average MSE for digit 9")

axes[1].plot(np.arange(0, 1.1, 0.1), psnr_sync[9], marker='o')
axes[1].plot(np.arange(0, 1.1, 0.1), psnr_som[9], marker='o')
axes[1].plot(np.arange(0, 1.1, 0.1), psnr_async[9], marker='o')
axes[1].set_xlabel("Corruption Level")
axes[1].set_ylabel("Average PSNR")
axes[1].set_xticks(np.arange(0, 1.1, 0.1))
axes[1].set_title("Average PSNR for digit 9")

axes[2].plot(np.arange(0, 1.1, 0.1), ssim_sync[9], marker='o')
axes[2].plot(np.arange(0, 1.1, 0.1), ssim_som[9], marker='o')
axes[2].plot(np.arange(0, 1.1, 0.1), ssim_async[9], marker='o')
axes[2].set_xlabel("Corruption Level")
axes[2].set_ylabel("Average SSIM")
axes[2].set_xticks(np.arange(0, 1.1, 0.1))
axes[2].set_title("Average SSIM for digit 9")

fig.legend(['Sync HN', 'SOM', 'Async HN'], loc = (0.4, 0), ncol=3)
mplcyberpunk.make_lines_glow()
[47]:
gc.collect()
[47]:
11268