Results
Plots for MSE, PSNR and SSIM
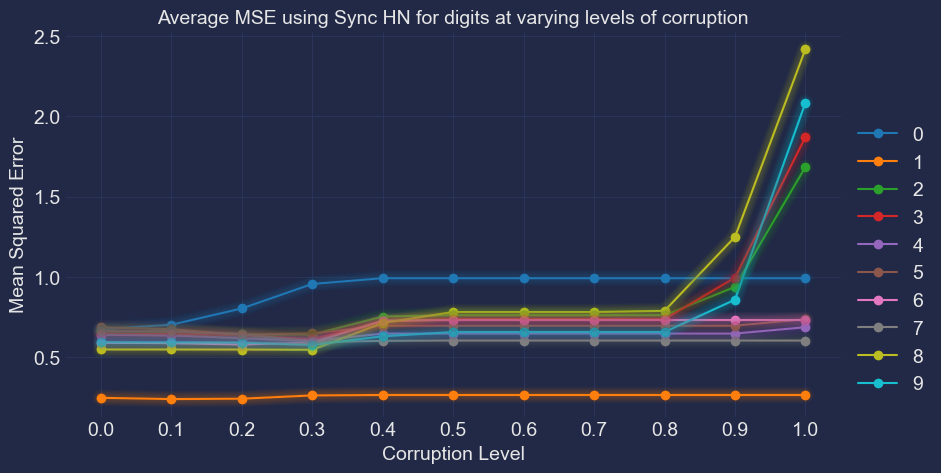
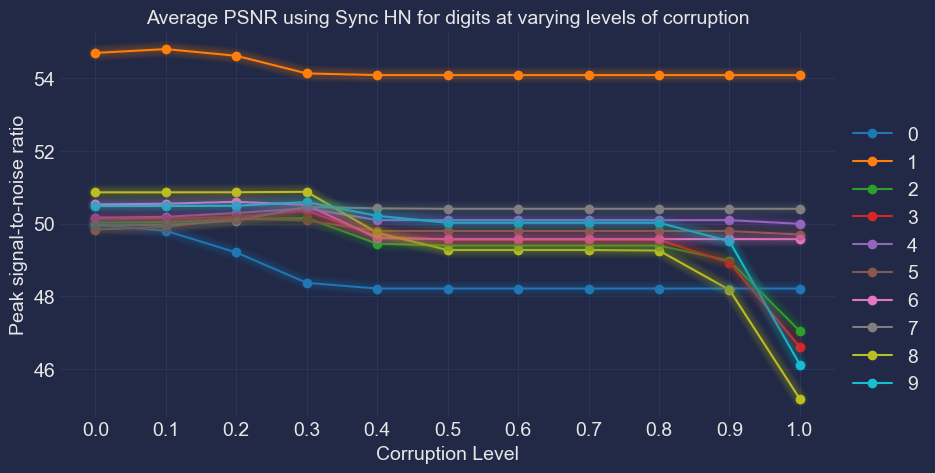
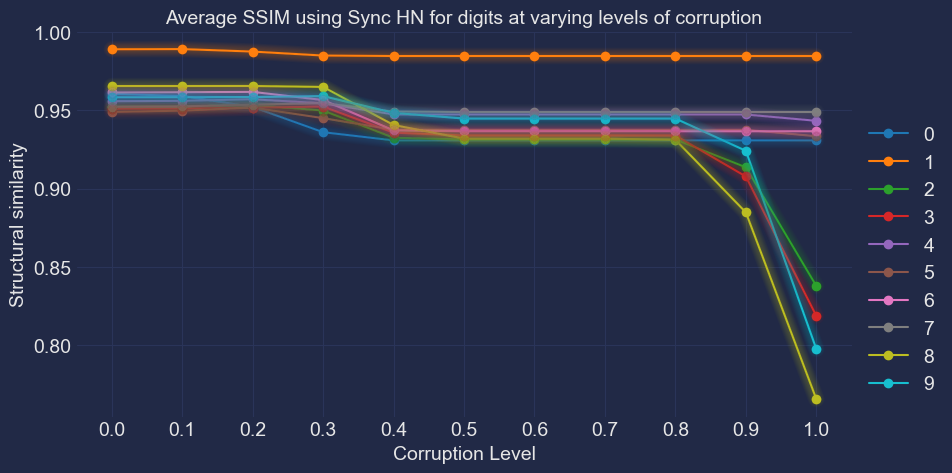
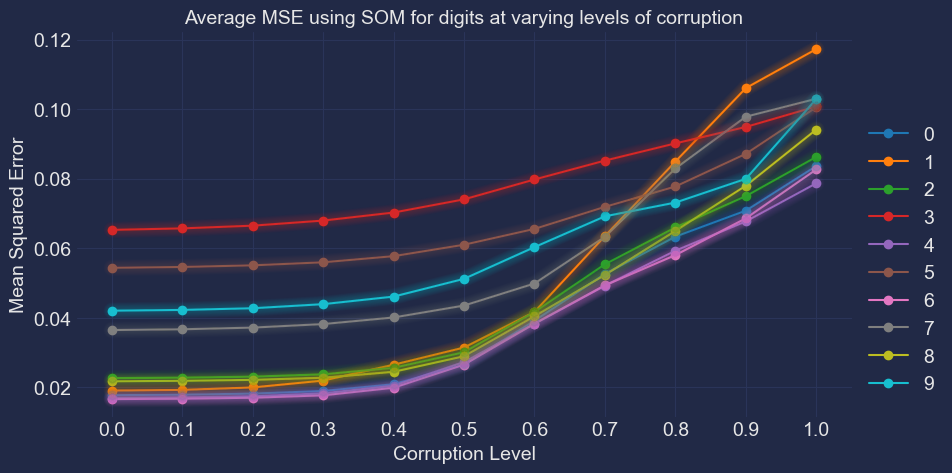
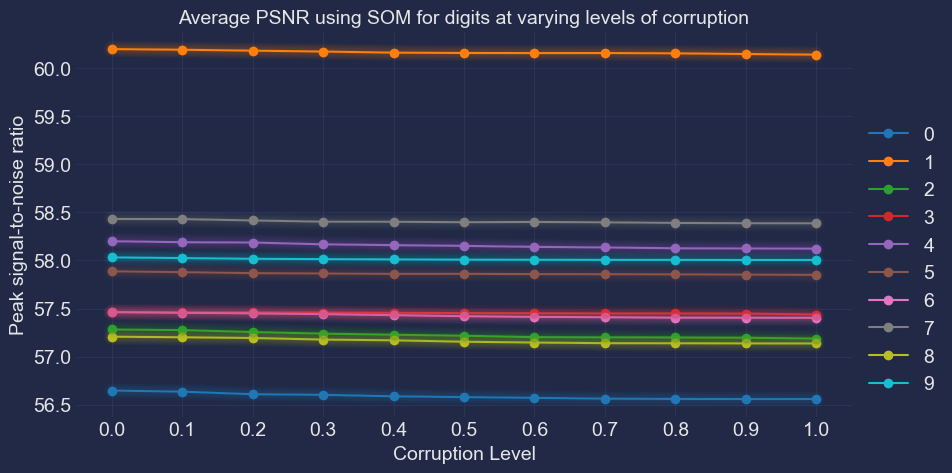
Metrics for each digit using Synchronous Hopfield are provided first, followed by those for Self-Organising Map. The final section compares these with the metrics for Asynchronous Hopfield, but aggregated across all 10 digits for brevity. For a digit wise comparison using all 3 approaches, refer to Detailed Comparison.
Synchronous Hopfield Network
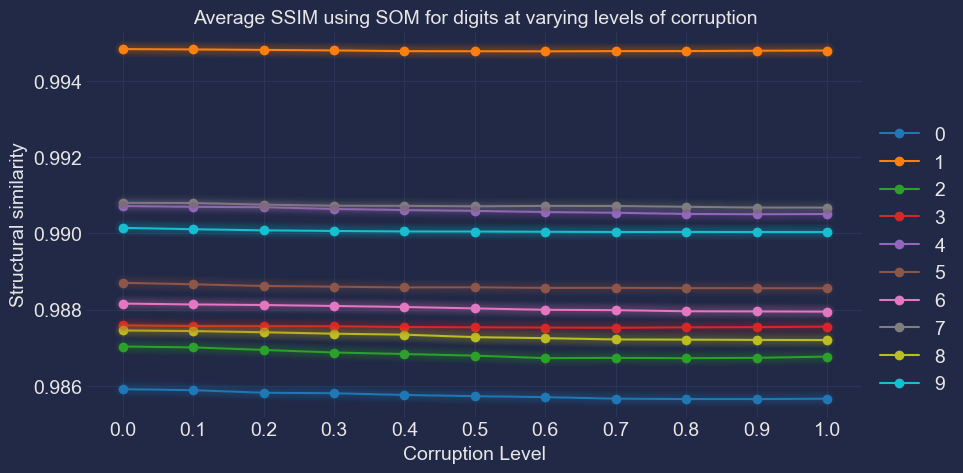
Self-Organising Map
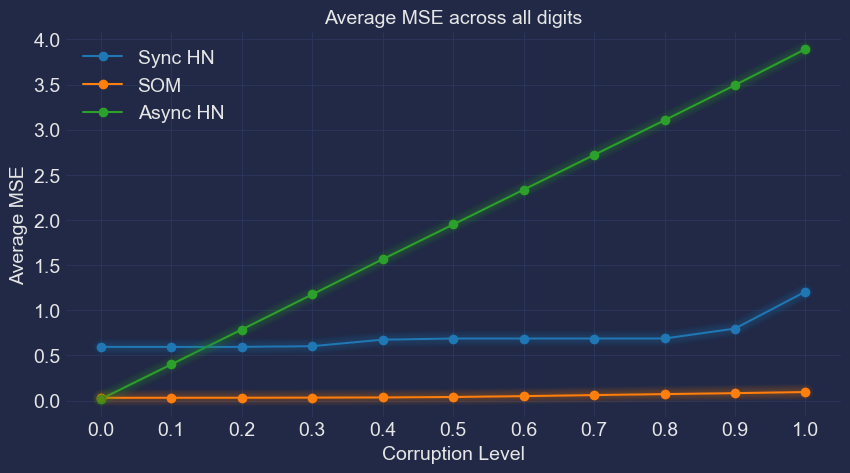
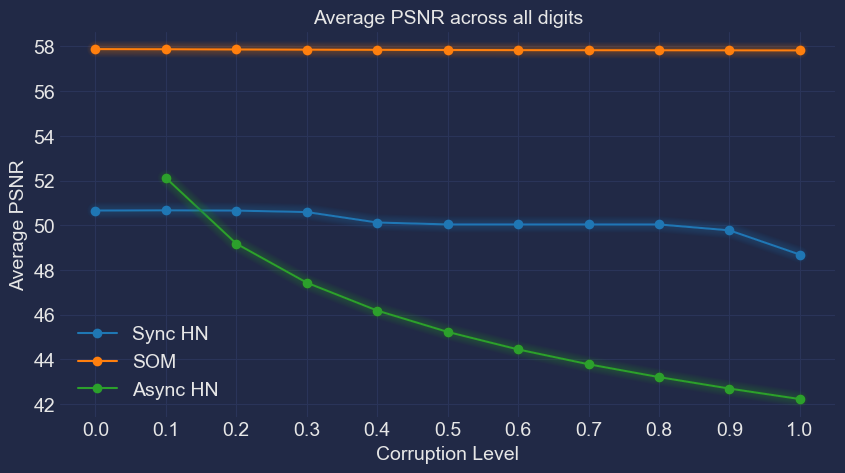
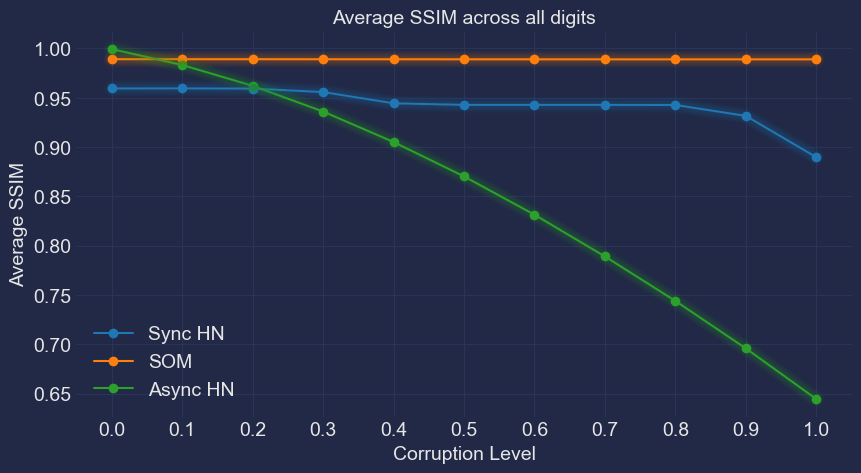
Sync HN vs Async HN vs SOM
Metrics aggregated across all 10 digits.
Note: Metrics for Asynchronous Hopfield Network are derived using Ruchita Mijagiri’s code